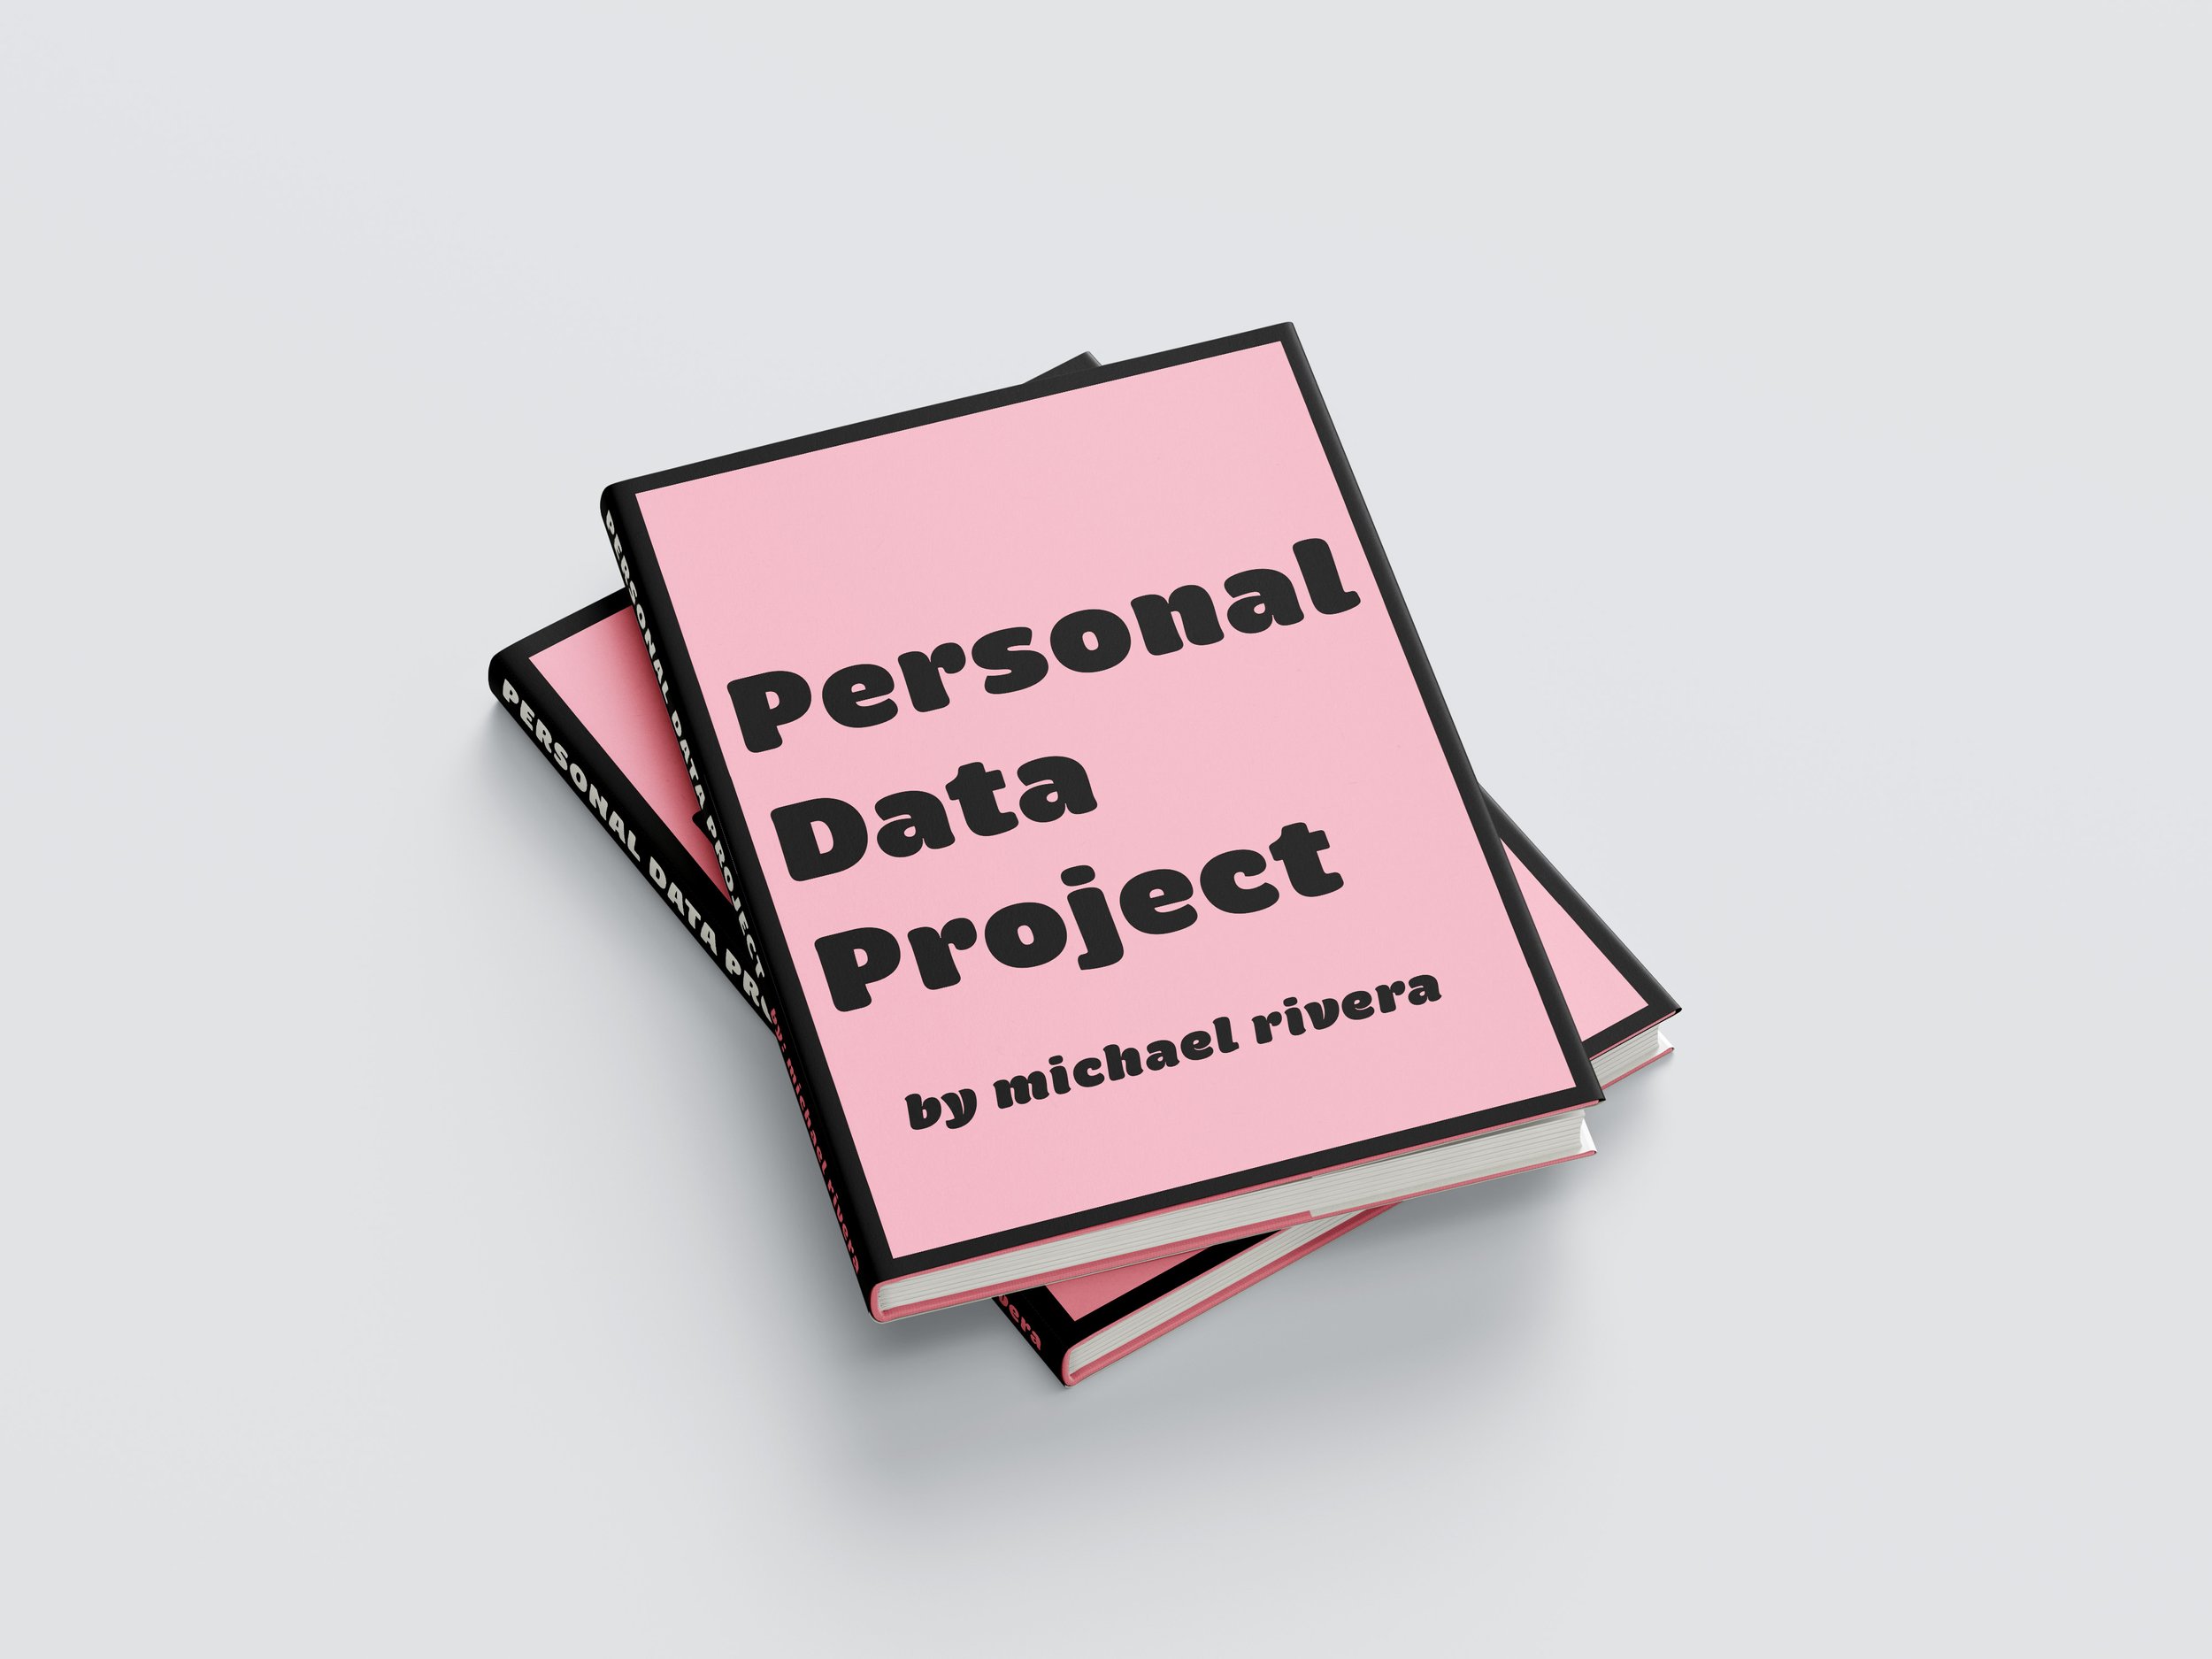
storytelling through data.
Track three pieces of data for a month. Create a visualization for the collected data.
Information Design Class Assignment:
The data I decide to track was what albums/songs I listened to in a day, what my outfits were for a day, and what my emotions (happiness, sadness, tiredness, anxiety, and anger) were for a day. I wanted to see if I could find any correlation between my music and outfits impacting my state of mood. My love for fashion, music, and video games led me to the idea of creating a coffee table book which would visualize this data akin to different character stat cards for a video game. For more details about the project please reach out!